Beyond The Bank Efficiency Ratio - A Better Measure
One of the most relied upon measures of bank operational performance is the efficiency ratio. It is used by bank management, analysts, investors, regulators and almost anyone interested in understanding the performance of a bank. But, is it an accurate measure of a bank’s efficiency and, if not, what is?
In the bank industry operational performance is typically measured in terms of efficiency on a financial basis. That is, efficiency is not usually thought of for banks in terms of volumes of work completed or time to complete specific tasks, such as the number of units of work completed in a particular time period. Such measures of efficiency are more relevant in manufacturing or other similar businesses. In bank operations efficiency is more commonly thought of in terms of efficiency on a financial basis, which is why the Bank Efficiency Ratio is so important in the industry. Simply stated, it measures efficiency by comparing costs incurred to operate the business to the revenue the business generates. The ratio is usually defined as follows:
Bank Efficiency Ratio = Non-Interest Expense / (Net Interest Income + Non-Interest Income -Provision for Credit Losses)
This measure has served the industry well by informing bank managers of how much their investment in operational resources is producing in income or, stated differently, what portion of their income is used to run the business. It is essentially the bank’s profit measure and can be thought of as the inverse of a profit margin.
Let’s consider what the “efficiency ratio” actually measures. Simply put, it is the ratio of the non-interest expenses (operating expenses) of a bank compared to its revenue. It could more properly be called the “expense ratio” because that is what it measures, not the actual efficiency of the bank. Fans of the efficiency ratio will claim that comparing the expenses of a bank to its revenue is a measure of efficiency in that it reflects the cost of running the bank per dollar of revenue, which it does.
Employing such a measure as a management decision influencing tool can be a problem in that it may tempt management to drive a bank’s efficiency ratio as low as possible to maximize profit. Unfortunately, this can also lead to problems like overloading the very resources generating the sought after income. Even in not-for-profit credit unions the temptation to minimize the costs needed to generate income can be powerful, although for some the temptation might be inverted to overspend on operations to benefit members while not maximizing revenue to sustain such benefits.
These possible problems are not typically due to a bank’s management intentionally overloading the bank’s resources, rather it is due to the lack of knowledge of the limit of operational efficiency for the bank. The Bank Efficiency Ratio does not indicate a limit to how much revenue can be generated from each dollar of operating resource. If a bank had an efficiency ratio of 40%, could possibly it reduce that to 35% or even 30% before it runs into problems and starts to erode revenue? And if there is a limit, is the limit the same for all banks or all credit unions?
Benchmarking is a step in the right direction to solving this problem, but most benchmarking is essentially a comparison of one bank to a set of similar banks in terms of characteristics like size of revenue and/or assets, geographic spread, profit/loss, etc. The problem with this approach is that comparing a bank to others based on such criteria many times leads to targeting mediocracy rather than indicating best possible performance. Some of the characteristics used to select comparable banks may be unrelated to identifying banks that are appropriate examples of excellence in operating efficiency.
What then is a measure of bank efficiency? Efficiency should indicate how much “bang for the buck” a bank gets from each dollar it spends on running the bank. In other words, did they get as much value from their expenses as they could have? The Efficiency Ratio shows what portion of revenue goes to operating expense, but not how that compares to what is possible or could have been achieved with each dollar spent on the bank’s operations. Consider, if we have two banks with the same efficiency ratio, does that mean they are both getting as much value from what they have spent on their operations? In a purely academic sense one could say yes, but what if the two banks were of vastly different sizes or have vastly different books of business or very different operating resources? Would it be possible that one bank has gotten more value from its expenditure on operations than the other based on such differences? Absolutely.
The question then is, what is “efficiency” for bank operations? What do we mean by getting the “biggest bang for the buck”? To determine this one needs a measure that takes into account factors such as those mentioned above like the nature of the business portfolio of the bank, its size, geographic spread, and many other factors. Accounting for all that gets complicated and cumbersome to manage in that it includes many distinct items that influence the operations of a bank. One would assume that this would mean looking at many separate measures and attempting to understand them all together. Fortunately, there is a way to measure efficiency that brings into account all those other factors in a relatively simple way, Efficient Frontier Analysis (EFA).
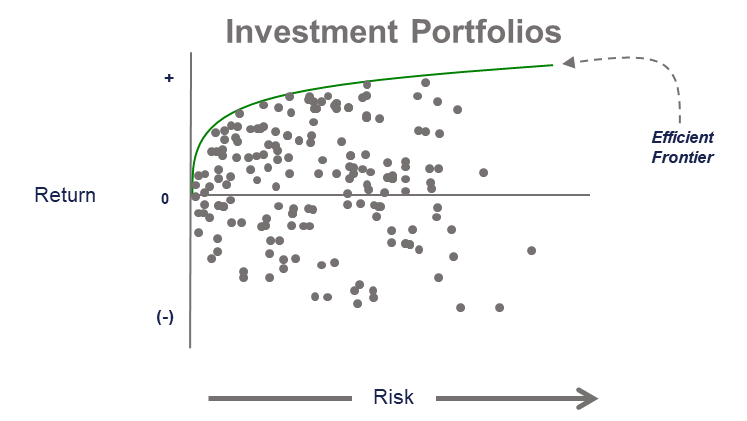
Most people reading this will likely have heard of EFA in connection with investment portfolio theory. Basically, EFA in investment portfolio theory is an examination of various investment portfolios with different mixes of investments (and thus varying levels of risk) and comparing the risk to the return each portfolio produces. This examination of all portfolios reveals the existence of an Efficient Frontier, a limit on performance across all risk levels. The Efficient Frontier is defined by the best performing portfolios and shows the limit of how much return can be had for any level of risk. Further, the efficient frontier is described mathematically. This means, in essence, that the Efficient Frontier is a naturally occurring limit that follows rules and is therefore predictable across all levels of risk. In fact, the Efficient Frontier is a curve showing diminishing returns as risk increases, something that makes sense and comports well with other principles of business. Because the frontier is defined by the actual performance of the best performing portfolios in the market, the efficient frontier naturally takes into account all relevant factors impacting the performance of each portfolio beyond just risk level such as portfolio size, market trends and economic forces.
Each investment portfolio can be compared to the efficient frontier to measure how much return it missed out on by not performing as well as the best performing portfolios. Knowing a portfolio could have performed better and how much should lead the portfolio manager to change the portfolio and how it is managed.
Hoeg & Company, Ltd. has developed a means of using Efficient Frontier Analysis to identify the Efficient Frontier for banks that operates in similar fashion, only applied to the operating measures of banks. We have developed analogous measures for banks that rate their Operational Efficiency and takes into account all factors impacting operating performance. Banks essentially produce (acquire & manage) business portfolios composed of varying levels of interest expense. To do this they use operational resources, people, facilities, systems, etc., at varying levels of cost. Those that do so best have the lowest operating cost relative to their given level of interest. Other banks can compare their cost level to the efficient frontier and know how much extra cost they are incurring for their given business portfolio of interest cost relative to best performance levels.

EFA measures are superior to and overcome the shortcomings of the efficiency ratio (the expense ratio). EFA provides a useful measure of efficiency by showing how close each bank is to best possible efficiency. The measures do not merely measure the efficiency level of a bank, they also define the limit of operational efficiency performance as it varies across the spectrum of business portfolios that banks manage, and thus takes into account industry trends and economic forces, as does the efficient frontier for investments.

In addition, EFA measures of operational efficiency exist for each cost component of bank operations separately to measure how much bang for the buck banks gets from their investments in operational resources such as staff, facilities and systems. Using EFA each category of expense reported in the Call Reports filed with the FDIC can be discretely measured to evaluate how efficiently it is used in the operations of all banks.
Examining the aggregate cost of banks provides an additional measure of excellence beyond just the overall operational efficiency for each bank. The Efficient Frontier created using the aggregate cost of banks forms what is best described as a swoop and thus has a low point. This low point is important because it indicates the business portfolio, the interest cost of the bank, that allows for the achievement of the lowest total operating cost or, in other words, the highest profit.

To highlight one of the key advantages of the EFA measure of Operational Efficiency and the difference between it and the efficiency ratio, consider two banks with very different business portfolios but the same total cost. Bank A has a book of business that requires higher servicing levels along with their associated costs. Bank B has a business portfolio that requires only low levels of servicing, primarily on an “exception” basis. One would expect the efficiency ratio of Bank A to be higher (more operating expense for each dollar of revenue) than Bank B, but is A less efficient than B? If Bank A’s interest expense is far less than Bank B’s, possibly because A’s clientele are willing to accept lower interest rates for greater service, couldn’t Bank A be more efficient? The answer is yes, possibly, but the efficiency ratio would indicate otherwise.
Below is a comparison of banks A and B using EFA.

Consider this, the preference for anyone looking at the traditional efficiency ratio for any bank is that it be lower. Unfortunately, the efficiency ratio does not provide any insight about what is the lowest possible level to which it can be taken. If we compared the efficiency ratios of Bank A and Bank B in the scenario above, we would be led to believe that both can reduce their operating expense and thus their efficiency ratio. This would be good for Bank B and disastrous for Bank A. EFA reveals the true nature, level and limit of Operational Efficiency at a very practical level. For Bank B, EFA measures can be developed to each of the underlying operating cost components of the banks to identify those with the greatest need to improve. For Bank A, note how close it is to the low point in the Aggregate Cost Efficient Frontier and how, if it changed its book of business slightly to align with that low point, it would find it could then reduce its operating expense significantly.
EFA goes well beyond the efficiency ratio in measuring real efficiency and provides practical measures of what cost improvement opportunities are possible for a bank, as well as, what benefits strategic changes in the overall business of a bank can provide. The efficiency ratio is useful, but it is really an “expense ratio” and not a measure of bank efficiency. Efficient Frontier Analysis provides a true measure of Operational Efficiency which brings with it deeper insights about the operational strengths and weaknesses of banks that allow those interested in the performance of banks to make better decisions about them.
If you are interested in learning more about Efficient Frontier Analysis for Banks or would like to access the measures for your own use, please contact Hoeg & Company, Ltd. at gjhesq@HoegCo.org.